Oregon’s THC Test Data Shows Consumers Shouldn’t Shop by THC Alone
Three Years of Data Show Similar Patterns to Washington and Nevada.
About a month ago, I wrote a story about how THC had the potential to destroy the cannabis industry, especially small businesses because as a discretionary threshold, it’s a highly corruptible metric. After I wrote that story, I reached out to all of the labs and several other industry veterans about a plan I had to create a round robin of test results, and I wrote about my plan a bit more in an article at the end of 2021.
Part of my plan included a public records request to the state, and I received the results early in the new year. While originally my exploration truly hinged on what I would find during the round robin of testing, what I found in the data was already quite interesting.
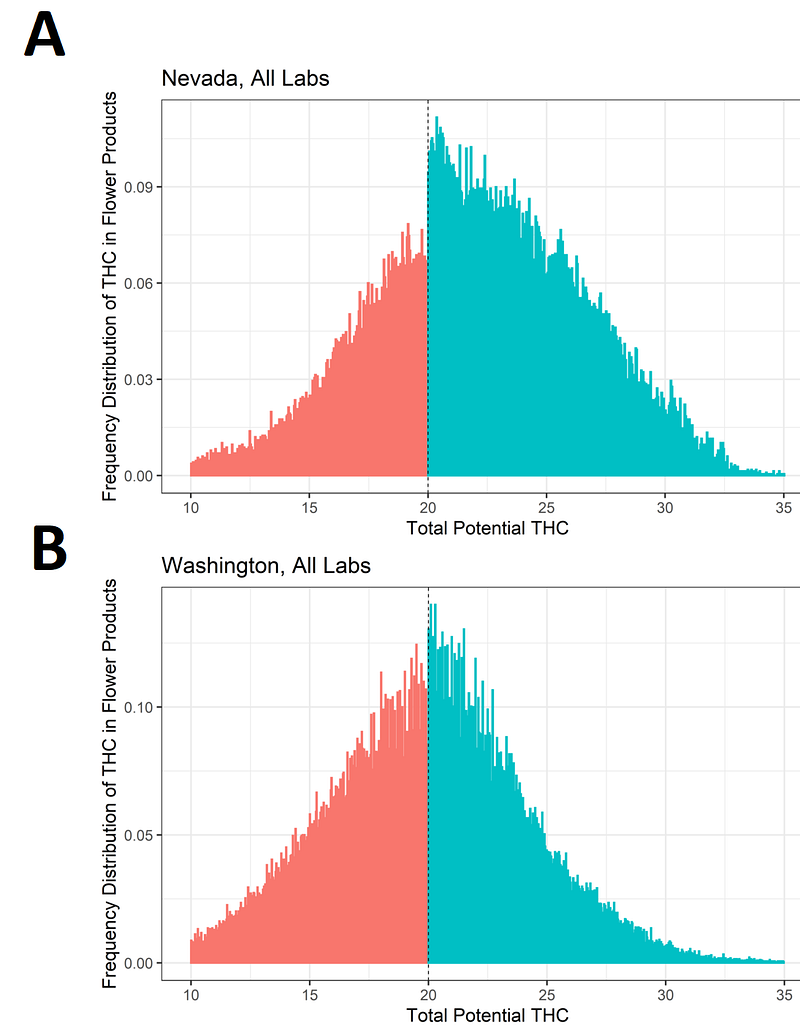
In the paper regarding the frequency distribution of THC results in Washington and Nevada, the researchers used a graph that I found to be very telling in what was happening with the data:
While I am not a statistician, I am an actual published author when it comes to collating data sources because of a 20 year long history working in health care data analysis and architecture. So while the creation of comprehensive statistical models aren’t my specialty, data analysis and visualization are.
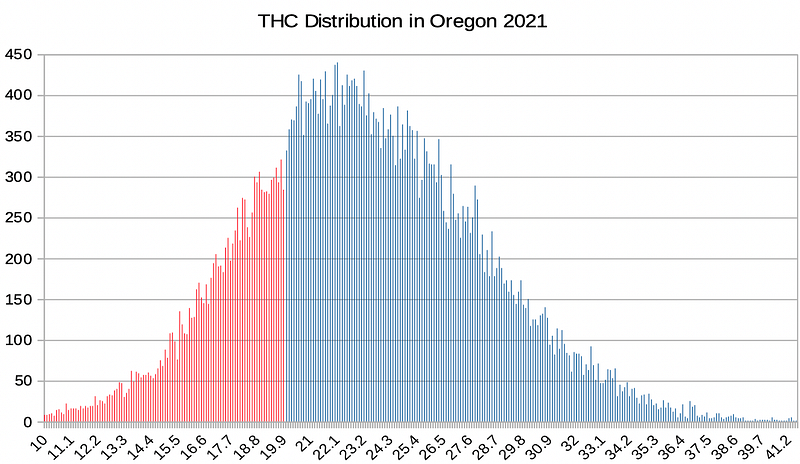
The graphs above are frequency distributions, which visualize how many tests had a particular value. I performed the same distribution on the data I received from Oregon for 2021. To do this, I eliminated outliers beyond 10% THC and 45% THC. The graphs above stop at 35, but there was still a fair amount of activity that high on the THC scale in Oregon.
The data I used was sent to me following my public records request to the Cannabis Tracking System in Oregon, which is METRC.
Much like in the frequency distributions in Nevada and Washington, there was a discontinuity around 20% THC.
As you can see, Oregon’s data appears to be between the Washington and Nevada data subsets shape wise. It shows the same depression / deformation of the normal curve directly before elevated results in the 20% range, with a tail that extends into the 40% range.
2020’s results yield a similar, but less drastic picture:

In January of 2019, there was a report by the Secretary of State who had conducted an audit. The audit highlighted failures in the laboratory system within the state of Oregon — and the data demonstrates there may still an issue. The graph for 2019 looks like this:
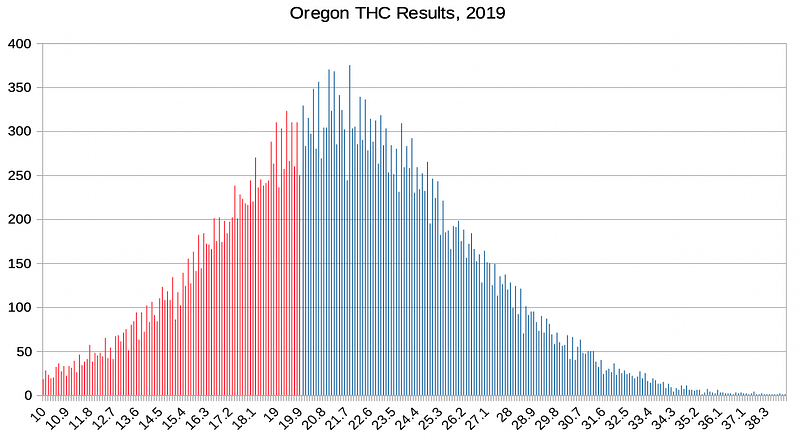
The last two years of data from Oregon demonstrate that Oregon’s THC testing patterns are similar to the patterns found in Washington and Nevada.
Over the next couple of months I will be working with the labs in Oregon to perform a round of testing on samples. Two labs have not agreed to participate, so I’m very grateful I could make a public records request — because I don’t need to run a single sample to know that there’s something up. It might be a quirk of the marketplace, it could be that the results normally don’t lie on a normal curve, it could have to do with slight process variances, genetic variances, seasonality — there’s a host of possibilities, and I’ll be exploring them in a series of articles to come.
These results are another reason why I urge all cannabis consumers to look beyond the THC value. Not only is the amount of THC not meaningful for most people, but the obsession with THC could be making that metric less useful by making it prone to corruption. Let’s help everyone out by being more informed cannabis consumers!
Article Sources: